
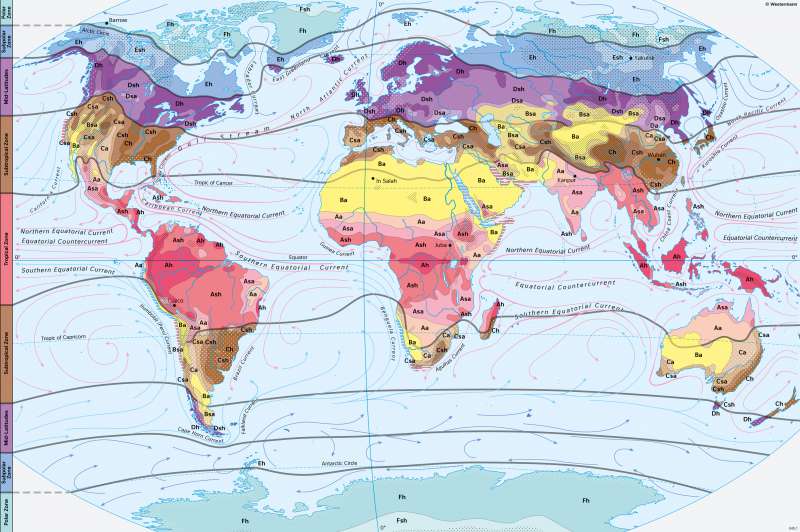
World climates (effective classification according to A. Siegmund and P. Frankenberg)
Climate zones
978-3-14-100890-6 | Page 16 | Ill. 4
Overview
Climate classifications are an important basis of geographical spatial analyses. Presented in the form of a map, they systematically show the spatial distribution of climatic conditions on earth. They provide a good overview of the most important climatic characteristics of a region. In climate maps, however, only a few climate parameters can be taken into account. Only in this way, however, is it possible to abstract, typify and classify certain climates despite the continuous change in climatic conditions on earth.
The starting points for the classification using the Siegmund/Frankenberg approach are the three climate elements of temperature, precipitation, and potential evapotranspiration. By consistently referring to these, each climate can be assigned without doubt to a certain climate zone and a specific climate type.
While maps 16.1-2 and 17.3 present elements of the climate classification or summarise statements from it in simple way, map 16.4 shows their cartographic realisation in combination with the three climate keys, in addition to representations of coastal fog and ocean currents.
First climate key: Thermal climate zones and dry climates
Heat and water balance are the essential variables of the natural and cultural conditions of an area. They are therefore central to the Siegmund / Frankenberg classification approach. Thus, the division of the Earth into five thermally defined climate zones (see 16.1) forms the basis of the climate classification (see 16.4). The annual average temperature of a climate station serves as a simple yet meaningful classification criterion. The thermal climate zones are abbreviated by the capital letters A, C, D, E and F.
A zonal arrangement of the thermal climate zones A, C, D, E and F is initially apparent across the Earth. This is almost ideal for the polar and Subpolar Zones as well as the Mid-Latitudes of the Southern Hemisphere. There, only the southern tip of South America, Tasmania and New Zealand cause minor bulges.
Particularly for the large continents, however, the climate zones often do not run parallel to the latitude circles. In the southern part of Africa, for example, there is a southward bulge in the tropics caused by the comparatively stronger heating of the land masses compared to the oceans. At the same time, the subTropical Zone on the west coast of southern Africa runs relatively far north in a narrow strip parallel to the coast. This is caused by the cold Benguela Current, which leads to the formation of fog and reduced solar radiation. Correspondingly, the California Current on the Pacific coast of Central America, for example, causes the subTropical Zone to extend southwards.
In western and northern Europe, as well as on the west coast of North America, warm ocean currents cause the Mid-Latitudes to bulge far to the north, even into areas north of the Arctic Circle. Both North America and Eurasia therefore show a contrast between the western and eastern sides of the continents.
In addition to the five thermal climate zones of the First Climate Key, the dry climates are additionally separated from zones A, C and D and combined into a separate climate zone named B. The 250-millimetre isohyete of the annual precipitation is used to distinguish the dry climates from the other climate zones. However, this only applies to the tropics, subtropics, and Mid-Latitudes in order to exclude polar and subpolar cold deserts, where very low precipitation can also occur, but where natural boundaries are set primarily by low temperatures.
Third climate key: Heat balance / continentality
On the third level of the classification approach according to Siegmund/Frankenberg, continentality is in focus. This statistical measure is based on the annual amplitude of the monthly average temperatures (TA).
With its help, four degrees of continentality can be distinguished within climate classification, which are abbreviated with numbers: high maritime (1), maritime (2), continental (3) and high continental (4). They are applied outside the tropics and are shown separately in 17.3 (grey signatures).
Within the tropics, the annual temperature fluctuations are too small for a meaningful subdivision to be achieved with the help of the annual temperature amplitude. Therefore, warm and cold tropics are distinguished from each other by the 24 °C isotherm of the annual average temperature (abbreviation: 5 or 6), since frosts also occur below this threshold in the tropics. In the map, the distribution of the cold tropics corresponds to that of the graphically highlighted mountain climates within the Tropical Zone. In map 17.3, the two areas are shown in yellow and pink.
Combination of climate keys
The combination of the three levels described above results in a tripartite climate key. Large parts of Central Europe, for example, lie in a semi-humid, maritime climate of the Mid-Latitudes, which can be abbreviated as Dsh2 climate using the climate key. Indonesia lies in the tropics, and the water balance is humid or semi-humid. Warm or cold tropics occur in the humid region. The three resulting climates can be abbreviated as Ah5, Ash5 and Ah6.
In order to evaluate the climatic conditions of a location, it makes sense to assign corresponding climate graphs to specific climate zones and climate types.
Second climate key: Hygric climate types
With the help of the number of humid months, four degrees of humidity or aridity can be distinguished: humid, semi-humid, semi-arid, arid. They form the second climate key, abbreviated by the lower-case letters h, sh, sa and a.
The statistical data on the water balance are based on the scientifically founded humidity concept of Lauer/Frankenberg. This contrasts the monthly precipitation (N) with the corresponding sum of potential evapotranspiration (pLV) as the actual physical counterpart of precipitation. In this way, the climatic water balance of an area can be precisely quantified. The potential evapotranspiration can be calculated on the basis of the potential evaporation of water areas (pV) and a conversion factor (Uf) depending on the vegetation and land use type according to the equation pLV = pV - Uf. If the amount of precipitation in a month reaches or exceeds the corresponding value of potential evapotranspiration (N ≥ pLV), it is defined as humid, in the opposite case (N < pLV) as arid.
Mountain climates and ocean currents
In the climatic map according to Siegmund / Frankenberg, the mountain climates are each shown as a separate climate type of the corresponding lowland climates (hatching). For this reason, the altitude of a station is taken into account, with a simplified assumption of a uniform vertical temperature gradient of 0.5 °C per 100 metres altitude difference. This allows the annual average temperature of the station to be converted to the temperature that the station would have if it were located at sea level.
The map 16.4 also contains a detailed representation of the near-surface currents, differentiated by temperature and speed. Ocean currents are mainly triggered by the thrust of the wind or different densities of water masses due to temperature and salinity variations.