Seasonal and diurnal climates
The world - Climate
978-3-14-100790-9 | Page 177 | Ill. 3
Information
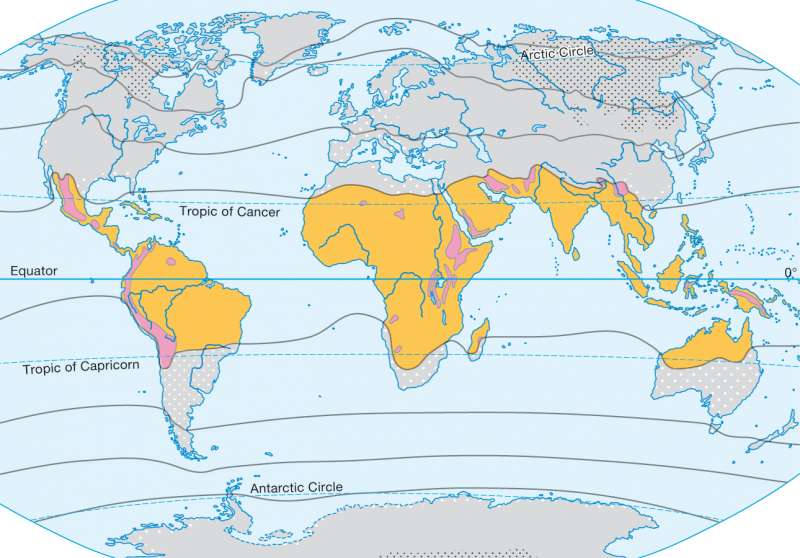
The climate maps represent the spatial dispersion of the systematic climatic ratio on the Earth. Therefore, they provide a good overview of the key climate characteristics of a region. For reasons of content and didactic reduction, only a few climate parameters are taken into account. It is only possible to typify and classify, despite the continuous changes of the climatic conditions on Earth abstractly affected by the climate. As a result, climate classifications are an important basis of geographical spatial analysis.Continental and seasonal-daytime climate
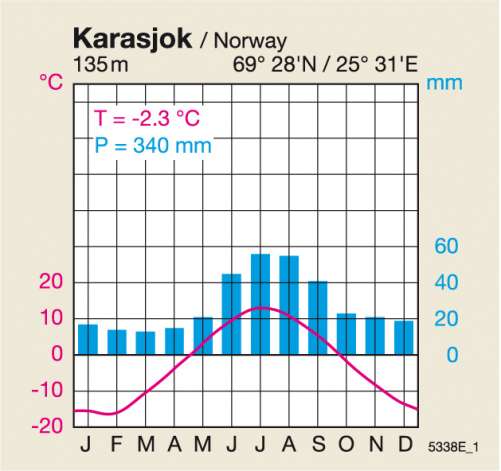
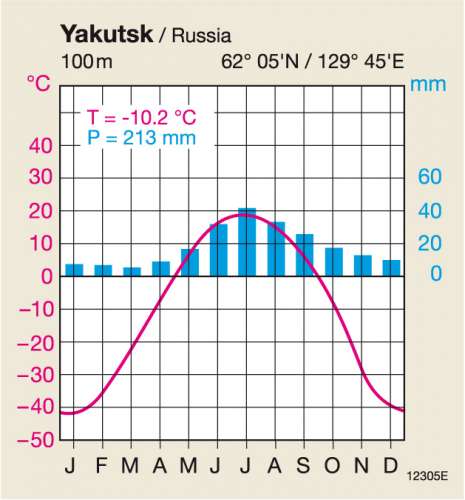
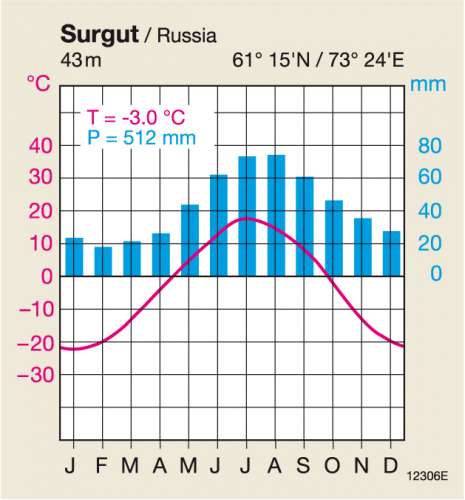
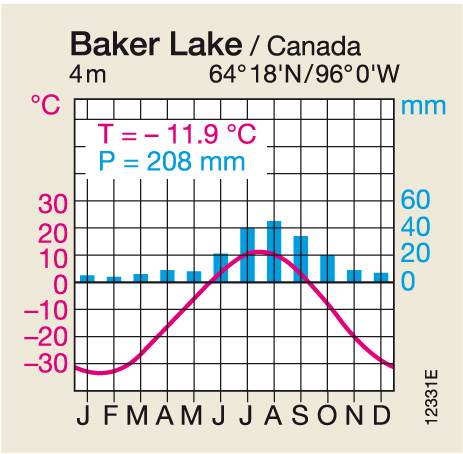
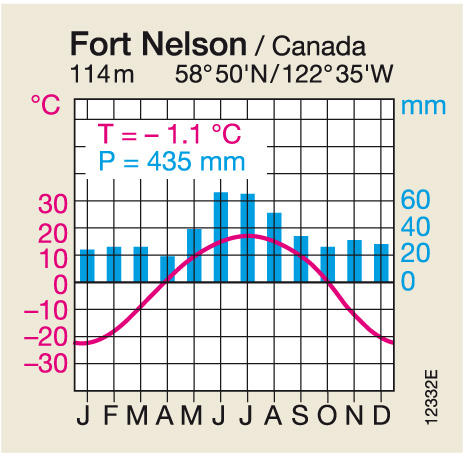
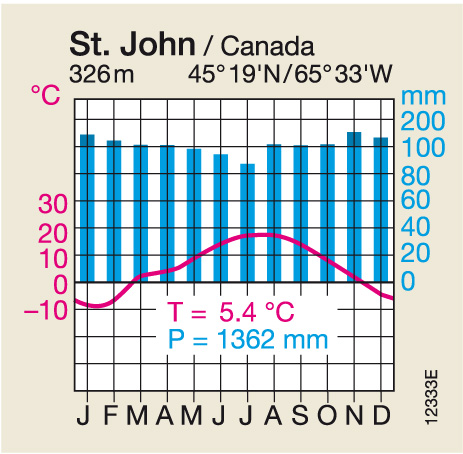
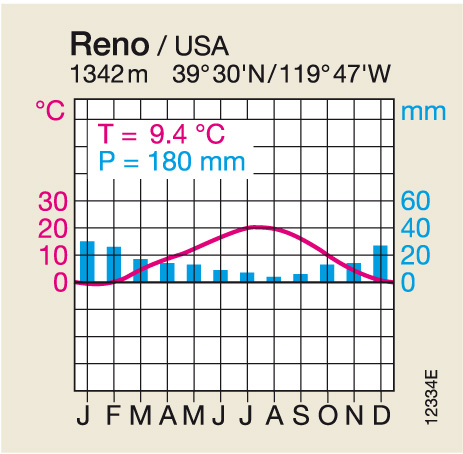
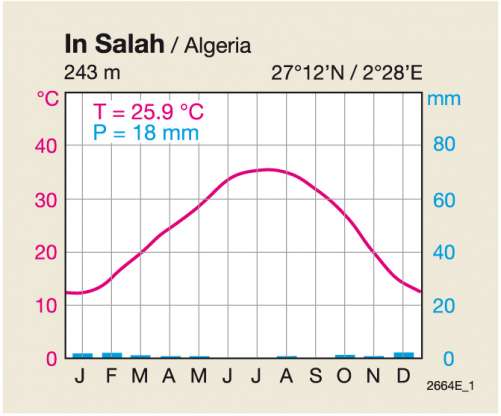
As a further breakdown of Siegmund/Frankenberg's classification approach, thermal continentality is used. This measure is based on the annual amplitude of monthly mean temperatures (TA). And so outside the Tropics, there are three continentality or oceanic grade differences in seasonal climates:
Maritime: 10 °C < TA ? 20 °C
Continental: 20 °C < TA ? 40 °C
High-Continental: TA > 40 °C
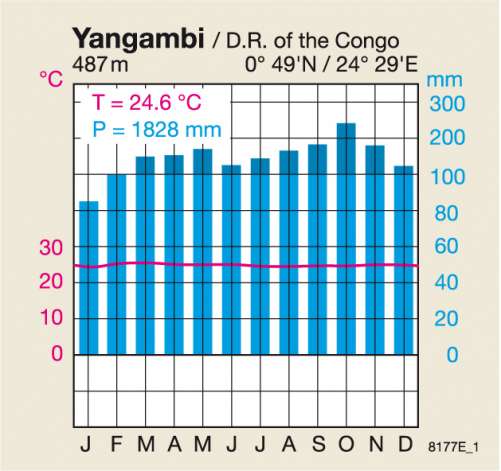
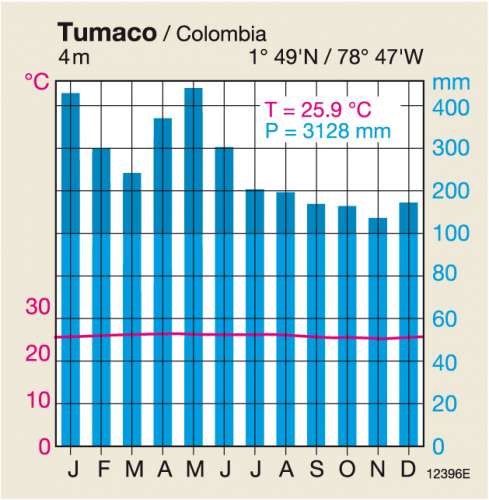
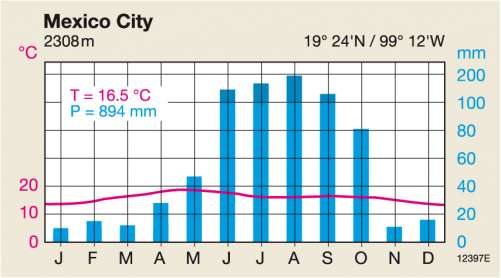
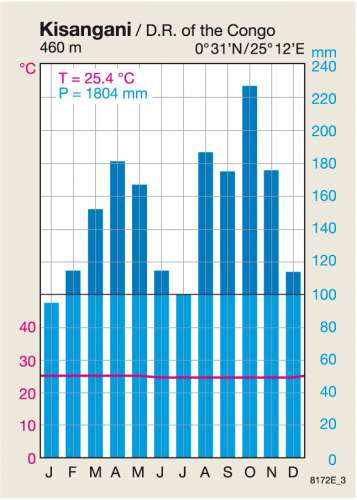
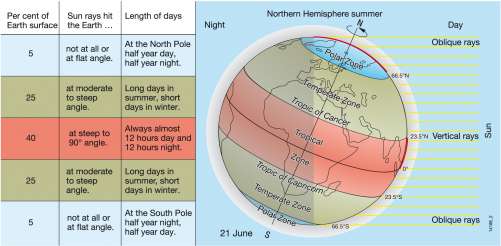
Within the Tropics the annual temperature variables/fluctuations are too small for the use of the annual amplitude enable a reasonable temperature breakdown. Under this daytime climate of 24-°C-Isotherm, the annual average temperature of the warm-Tropics is separated from the cold-Tropics; below this threshold tropical frosts occur. On Siegmund/Frankenberg's climate map, the distribution of the dislpayed cold-Tropic and high altitude climates are graphically highlighted within the Tropical zone.
A. Siegmund; Ü: C. Fleming
Graphics