
Russia and neighbouring countries of the former Soviet Union - Regional disparities
Regional development
978-3-14-100890-6 | Page 114 | Ill. 2
Overview
The map composition "Regional disparities" for the federal districts or federal subjects of the Russian Federation as well as neighbouring countries of the former Soviet Union is one of 5 such map displays in the atlas - the other being the British Isles (UK & Ireland, see 83.4), India (see 123.6), China (see 126.1) and Brazil (see 196.1). The purpose of these map compositions is to establish a sub-national country profile based on a set of similar statistical indicators (such as population development within the last 10 years, gross domestic product, both per capita as well as over time). It is thus possible to compare the subsequent regional patterns of a common statistical indicator among the aforementioned set of countries.
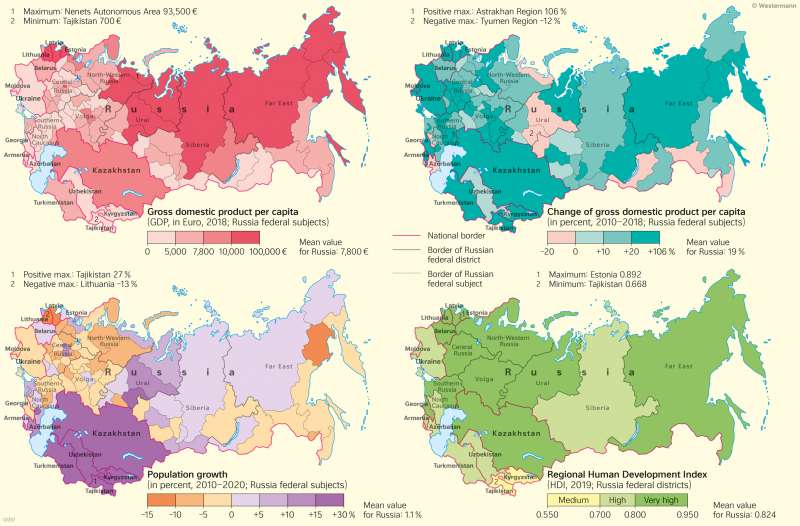
Economic and demographic disparities
The four maps for Russia and its administrative entities as well as the countries of the former Soviet Union show the gross domestic product (GDP) in Euro 2018, the GDP change 2010-2018, population growth (sometimes negative) and the Human Development Index (HDI). The regional patterns for each of the four indicators are not always easy to establish.
Easiest is probably the HDI, which is very high in the Baltic states, Georgia, Kazakhstan and in all of Russia except the federal districts of Siberia and North Caucasus, where it is high just as in Moldova and Ukraine, Armenia and Azerbaijan, Turkmenistan and Uzbekistan and medium in Tajikistan and Kyrgyzstan.
Population growth is high in Central Asian countries and less high but positive in Caucasian countries and regions (except Georgia), east of the Ural mountains (except along the Pacific coast and most of the border to China) as well as around Moscow and St. Petersburg. It is very negative in Latvia and Lithuania but less negative in Moldova and Ukraine and in most of the European Russian heartland except Moscow and St. Petersburg.
GDP per capita is high in the Baltics, St. Petersburg, Moscow and Kazakhstan and surprisingly high in Northern and Eastern Siberia, the Ural and Northwestern Russia. This is probably due to oil and gas mining as well as other resouces and a strong industrial sector.
The change in GDP per capita 2010-2018 gives a mostlöy positive picture expect a few regions in the Ural, the Caucasus and along the Chinese border.