
The World - Seasonal and diurnal climates
Climate zones
978-3-14-100890-6 | Page 17 | Ill. 3
Overview
Climate classifications are an important basis of geographical spatial analyses. Presented in the form of a map, they systematically show the spatial distribution of climatic conditions on earth. They provide a good overview of the most important climatic characteristics of a region. In climate maps, however, only a few climate parameters can be taken into account. Only in this way, however, is it possible to abstract, typify and classify certain climates despite the continuous change in climatic conditions on earth.
The starting points for the classification using the Siegmund/Frankenberg approach are the three climate elements of temperature, precipitation, and potential evapotranspiration. By consistently referring to these, each climate can be assigned without doubt to a certain climate zone and a specific climate type.
While maps 16.1-2 and 17.3 present elements of the climate classification or summarise statements from it in simple way, map 16.4 shows their cartographic realisation in combination with the three climate keys, in addition to representations of coastal fog and ocean currents.
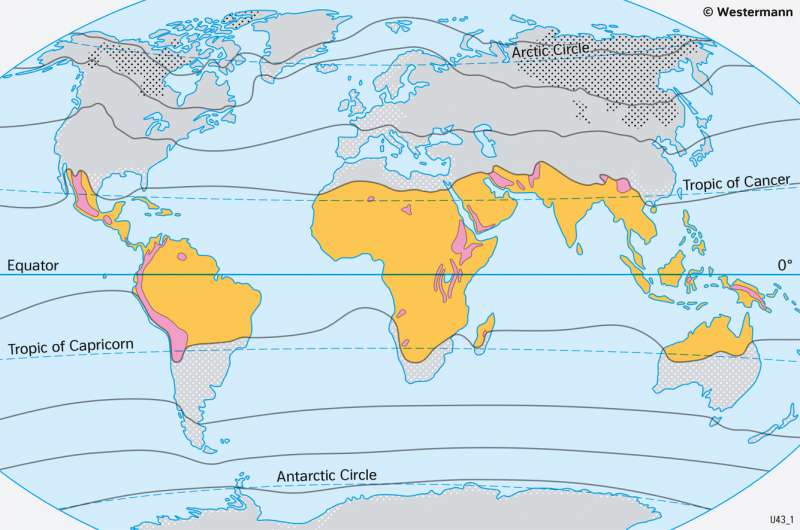
Seasonal and djurnal amplitudes of temperature
On the third level of the classification approach according to Siegmund / Frankenberg, continentality is being focussed on. The subsequent statistical measure is based on the annual amplitude of the monthly average temperatures (TA).
It is applied to distinguish between four degrees of continentality, which are abbreviated by numbers: high maritime (1), maritime (2), continental (3) and high continental (4). They are applied only outside the tropics and are shown separately on the map (grey signatures).
Within the tropics, the annual temperature fluctuations are far too small for a meaningful subdivision to be established with the help of the annual temperature amplitude. Therefore, warm and cold tropics are separated by the 24 °C isotherm of annual average temperature (abbreviation 5 or 6), since frosts also occur below this threshold in the tropics. On the map, the distribution of the cold tropics corresponds to that of the graphically highlighted mountain climates within the Tropical Zone. In map 17.3 the two areas are shown in yellow and pink.