
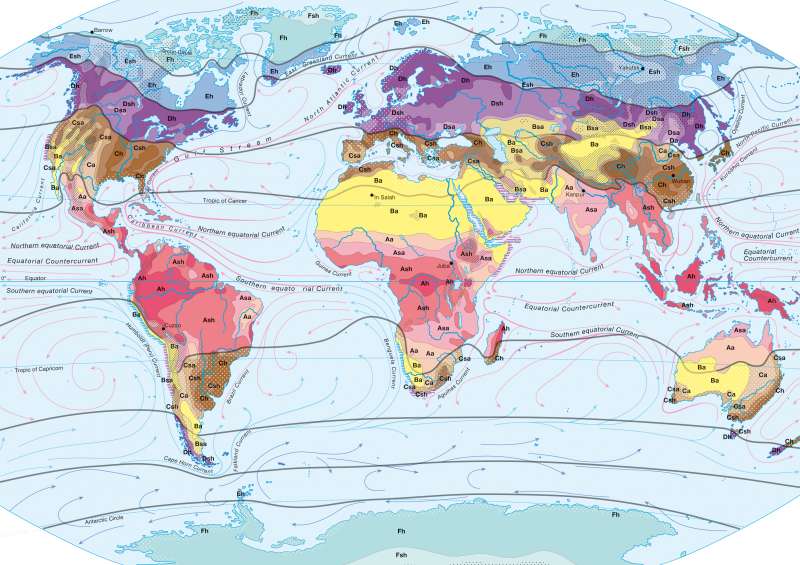
World climates — Effective classification after A. Siegmund and P. Frankenberg
The world - Climate
978-3-14-100790-9 | Page 176 | Ill. 4
Information
The climate maps represent the spatial dispersion of the systematic climatic ratio on the Earth. Therefore, they provide a good overview of the key climate characteristics of a region. For reasons of content and didactic reduction, only a few climate parameters are taken into account. It is only possible to typify and classify, despite the continuous changes of the climatic conditions on Earth abstractly affected by the climate. As a result, climate classifications are an important basis of geographical spatial analysisSiegmund/Frankenberg's Effective Climate Classification
Effective climate classifications are based on the values of certain climate elements such as temperature and water balance. The genesis of the various forms is not considered. According to A. Siegmund and P. Frankenberg , the map of the Earth's climates, goes back to an approach by Siegmund in 1995. This takes into account, in addition to modern technical-scientific knowledge, specific educational considerations.
One of the particular characteristics of Siegmund/Frankenberg's climate map (1999) is its "Modular System". In this way, structure and complexity of climate classification can be adapted to the specific age and school orientation. Requirements can be adapted and systematically developed across the grade levels. The entry level for all criteria under consideration are the three climate elements: temperature, precipitation and potential evaporation landscape. Through consistent reference to these climate elements, there is no doubt that each climate has a certain climate zone and a specific related climate type. Siegmund/Frankenberg's climate map shows three ecological climate viewpoints at the centre of the classification: the climate zones with their respective heat and hydrology (displayed by upper case letters), the hygric climate types (displayed by lower case letters) as well as the respective continentality (represented by a raster signiture).
Climate Diagrams
The climate diagrams are built up from three axes. The horizontal axis shows the individual months of the year. On the left vertical axis is the temperature in degrees celcius. The right vertical axis shows precipitation in millimetres. One millimetre of precipitation height equates to one litre of water precipitation per square metre. Additional information is set in the diagram; the yearly average temperatures and the average annual totals of rainfall recorded by each station.
In line with previously widespread climate diagrams from Walter/Lieth, the temperature and precipitation values of both perpendicular axes are compared in the ratio 1 : 2. Thus, 10 °C of the temperature axis corresponds to 20 millimetres of the precipitation axis; 20 °C corresponds to 40 millimetres etc. A rough estimate can be calculated as to whether in any given month, humid or arid climatic conditions prevail. The illustrated range of climate diagrams includes the main climatic zones of Siegmund/Frankenberg's climate map. In the map, the respective locations of climate stations are listed for comparison.
A. Siegmund; Ü: C. Fleming