
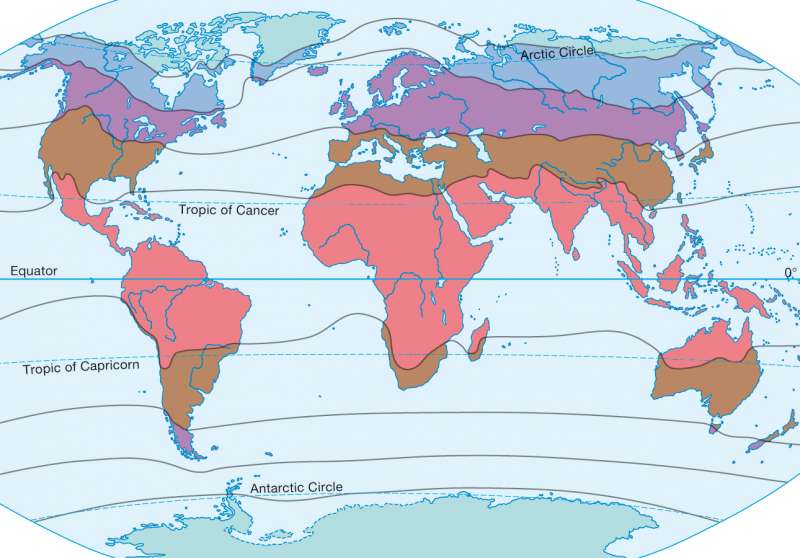
Thermal climate zones
The world - Climate
978-3-14-100790-9 | Page 176 | Ill. 1
Information
The climate maps represent the spatial dispersion of the systematic climatic ratio on earth. Therefore, they provide a good overview of the key climate characteristics of a region. For reasons of content and didactic reduction, only a few climate parametres are taken into account. It is only possible to typify and classify, despite the continuous changes of the climatic conditions on Earth abstractly affected by the climate. As a result, climate classifications are an important basis of geographical spacial analysis.Thermal Climate Zones
The climate maps represent the spatial distribution of heat and water which are the key performance measures of the natural and cultural realities of an area. Such measures are the focus of the classification approach of Siegmund /Frankenberg.
Firstly, the division of the terrestrial climates was defined into five thermal climate zones, on the basis of climate classification, when a simple and nevertheless significant division criterion is used along with the average annual temperature (TD) of a climate station. Through using this temperature indication, the five climate zones can be bordered with one another.
A particular problem is the professional and educational association of the mountain climate. In Siegmund/Frankenberg's climate map, the high altitude climate is entered in contrast to other classifications, each with a separate climate type of a corresponding, designated lowland climate. For this reason, the significance of a station's altitude is considered and for simplicity, a uniform vertical temperature gradient of 0.5 °C per 100 m is used. This enables the average annual temperature, by using the data on the level of a climate station reduced to sea level. In the map, these areas of high altitude climate are graphically highlighted.
With the help of the annual sum of precipitation as already observed on the climate map, the first outline roughly defines the regions of the Earth, in which the permanent or periodic water shortage of an area is the most influential climatic factor.
In this way, dry climates of 250 mm of annual rainfall isohyete from other climates, are deferred. This is only true for the tropics, subtropics and temperate zones. In order to exclude polar and sub-polar cold deserts, despite the low rainfall, mainly the temperature of the critical natural environment limits are featured (see map 2).
The dry climates of the climate zones are identified according to the climatic classification of Koppen / Geiger (1928) and Lauer / Frankenberg (1988), the capital letters A (tropical) to F (polar zone). The dry climates are denoted by B.
A. Siegmund; Ü: C. Fleming